

The Best Macro Indicator
An overview of what bond yields are, what influences their movements, and how you can make investment decisions by studying them

Bonds generally always tell the truth. You just have to learn to listen - Raoul Pal
The Best Macro Indicator
Bond yields are one of the best macro indicators you can have on your watchlist as they tend to filter out the noise of other asset classes and give you a clear view of the underlying economy.
Retail investors tend to avoid looking at bond yields for 2 reasons:
The return an investor can yield from holding bonds has decreased severely over recent years as tech stocks and crypto have entered into the mainstream offering outsized returns.
They don’t understand them.
The biggest edge you can attain in the market is by studying how bond yields move and what they’re signalling to you. A lot of legendary macro investors were known as being great bond traders back in their day. However, in today’s age, returns of 1.52% over a 2 year time period just aren’t cutting it when inflation is sitting at 7.5%!
They’re also usually the first asset class to pick up on changes in growth and inflation so that will aid your bias towards the market.
The easiest way for me to describe them would be that they’re representative of interest rates over different time periods. An interest rate is the percentage you pay for borrowing money, when you invest in a bond that percentage (or yield) is what you earn for lending money.
Who are you lending that money to though?
This is where the type of bond comes in.
Corporate Bonds and Government Bonds.
Corporate bonds can be issued by companies in order to raise investment for new projects or maintain ongoing operations. A good example of this was Microstrategy back in June 2021. They issued $400 million worth of bonds in a private offering with a view to invest that $400 million into Bitcoin.
The mechanism of this would be company A buys a bond from Microstrategy. In return, Microstrategy must pay the holder of that bond the yield agreed within the contract. Returns of between 6.125%-6.25% were floated for these “Bitcoin bonds”, eclipsing the returns offered by any US government bond.
Corporate bonds can be slightly riskier as the company issuing them can default, government bonds however are much safer investments. US bonds currently hold the highest demand globally as they offer the best yields so we’ll focus on these going forward.
Short Term Yields
As I mentioned in the beginning bond yields are representative of interest rates over different time periods. Each one of those time periods are referred to as the “maturity date” i.e when the borrower must pay you back your investment.
Short term yields are anything between 1-5 years.
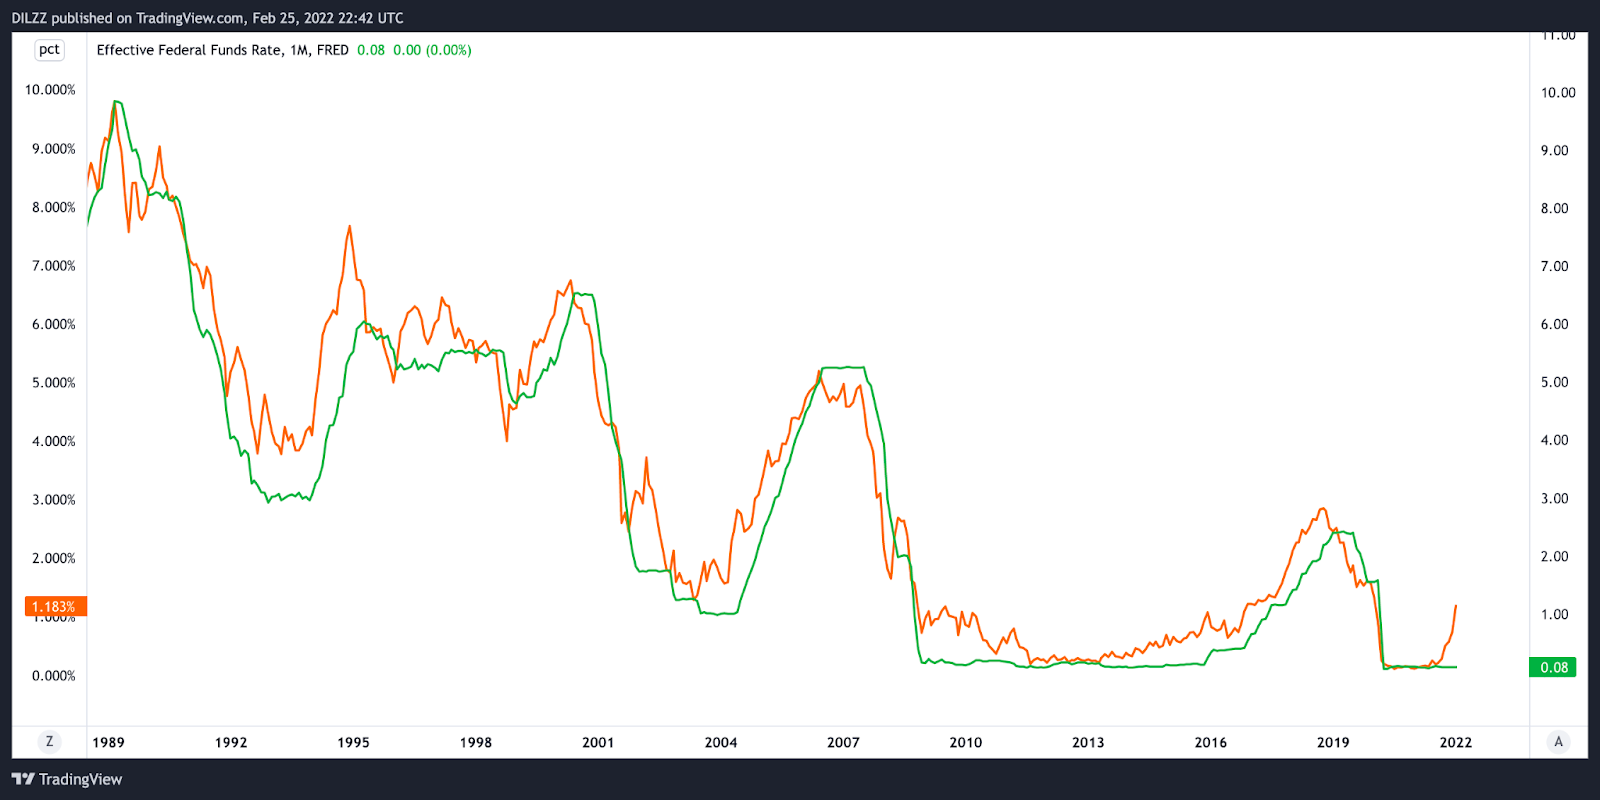
You can gage the trajectory of short term yields by looking at the US02Y, as it’s essentially in direct correlation to the fed funds rate (the interest rate at which banks and financial institutions can lend to one another overnight). When looking at short term yields the 2Y should be your guiding light, this will give you an indication of the potential path of interest rates in the short term.
Looking at the chart below you can clearly see the direct correlation between the US02Y (orange) and the fed fund’s rate (green). 2Y yields are rising as investors are anticipating the Fed will be raising interest rates over the next few months, but with the US02Y sitting at 1.52% and the fed funds at 0.08% they have some catching up to do…
Long term yields
Long term yields are less impacted by the fed funds rate and are more impacted by market and economic forces (which we’ll take a look at later).
Long term yields are 10 years +.
Out of all the long term maturity dates the US10Y is the most important. It serves as a proxy for investor confidence in the markets and the economy, so keeping an eye on this can give you a view of whether you should be risk on or risk off.
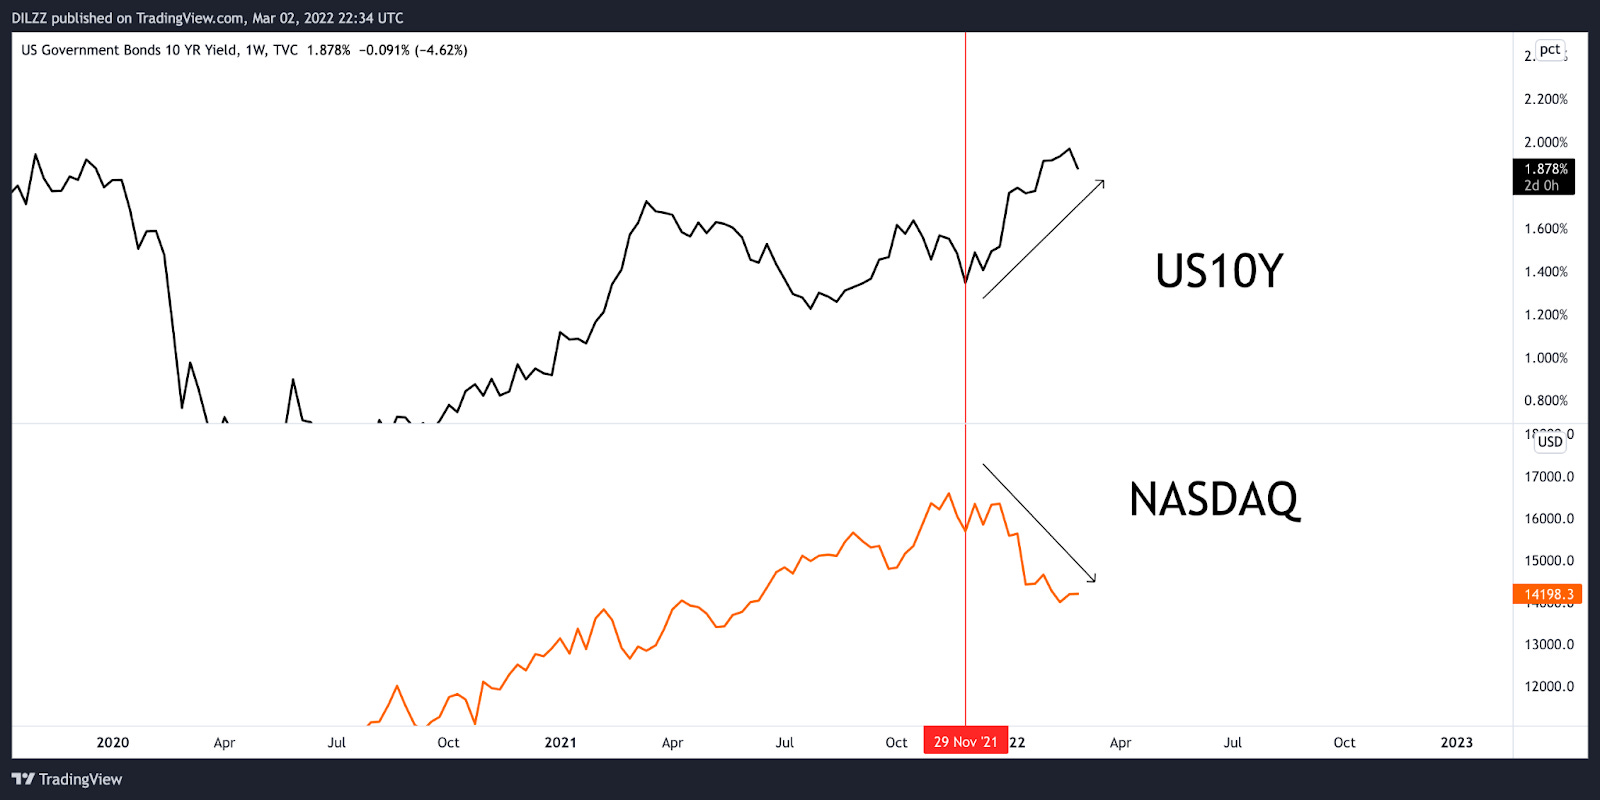
For example, one correlation to pay attention to is the US10Y and the Nasdaq. When the 10Y is rising and the Nasdaq is falling it’s indicative of a risk off environment. Bitcoin tends to hold a higher correlation to the Nasdaq during these types of periods too. Remember, tech stocks tend to underperform in a high interest rate environment due to the impact higher rates have on the present value of future cash flows.
You can see in the chart below the Nasdaq put in it’s high during November 2021 when the Fed pivoted on it’s inflation narrative and decided to take a more aggressive approach to normalising it’s policy. This also coincided with a bottom in the US10Y (orange line) and the two have been negatively correlated since.
What Factors Affect Bond Yields?
There are essentially 3 factors that influence how they move:
Economic growth expectations
Interest rates
Inflation
Bond yields are positively correlated with all 3 of the above factors. The reason we’ve seen such a frenzy in global bond yields at the moment is because inflation is high, and investors are anticipating central banks to raise interest rates. Both of these variables warrant higher bond yields.
The one other factor I didn’t mention that influence the movement of bond yields are central banks.
Below is a chart of the US10Y over time. Going back to ‘point 1’ right at the beginning of this newsletter you can see why bonds have become less attractive to investors over the years! In the 1980s the yield on the 10Y was up at almost 16% this is now at 1.96%.
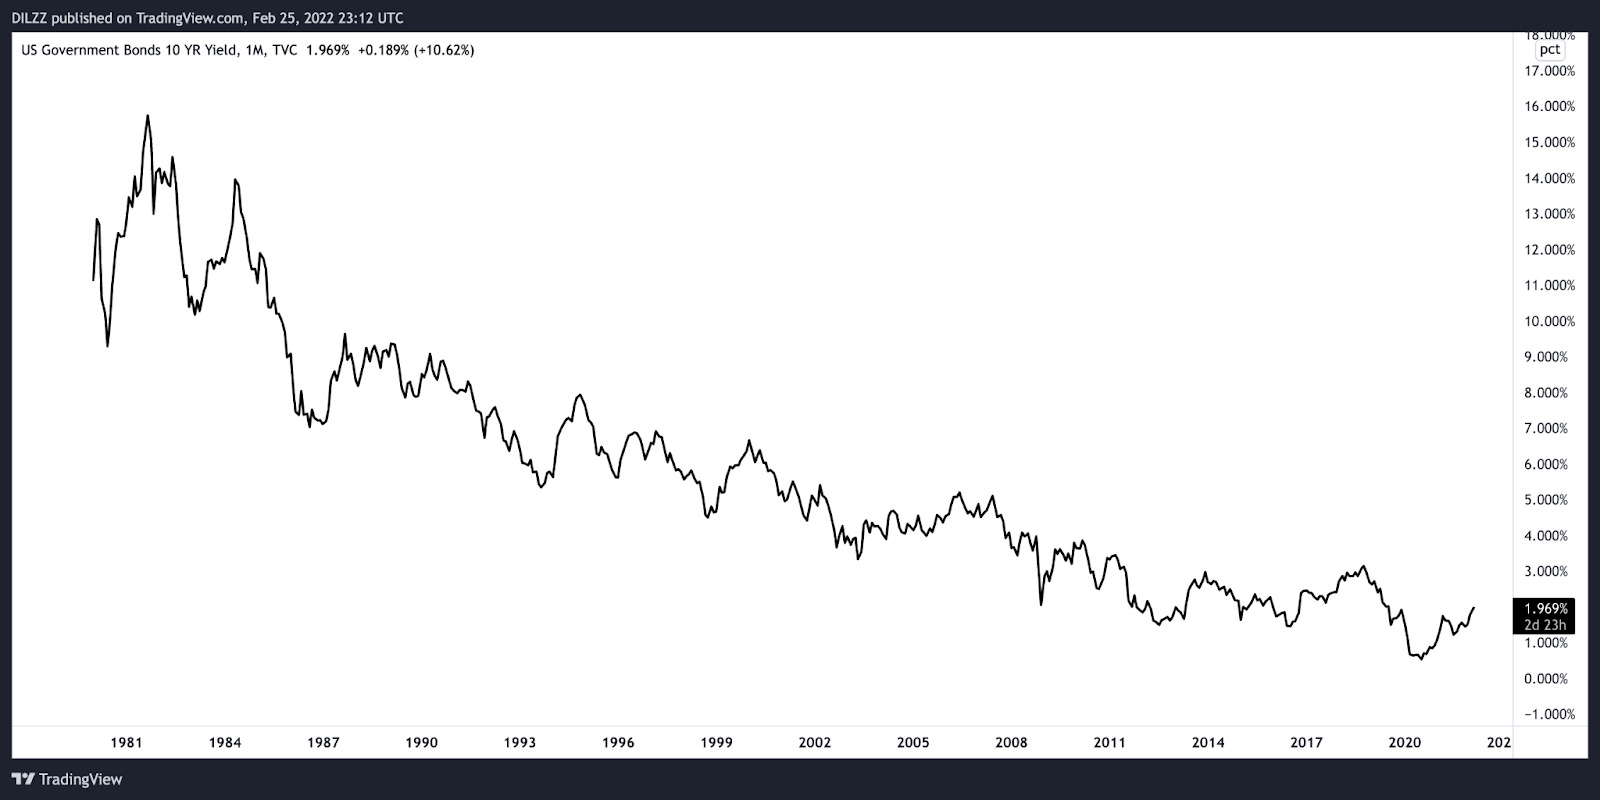
This has been due to decades of QE and the mountains of debt racked up over decades. So, how do you write off trillions of dollars worth of debt? You inflate it away through low interest rates.
Anyway, I’ll save that for another newsletter!
Your Watchlist
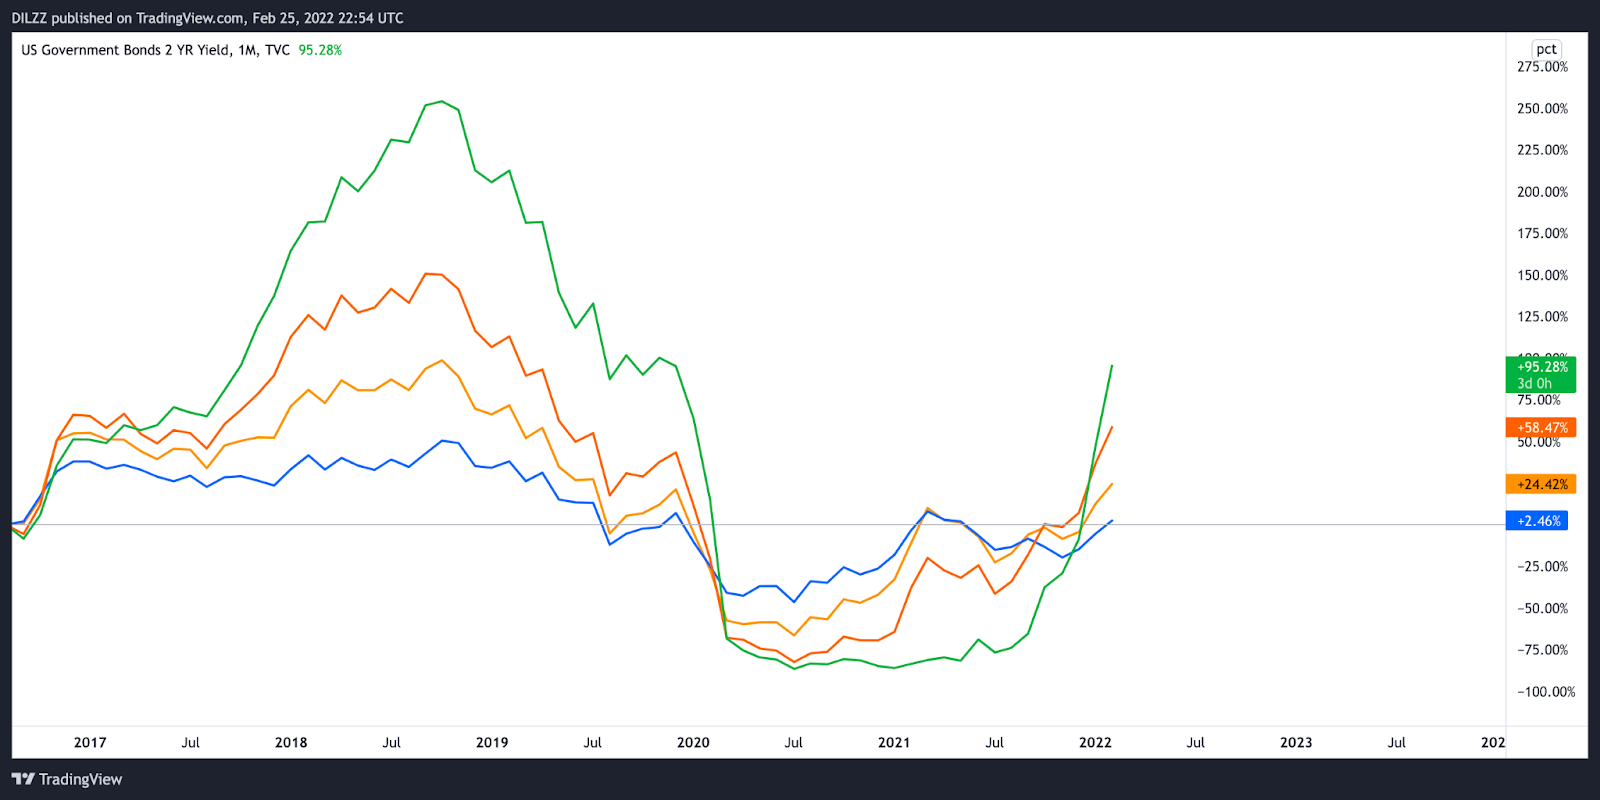
In the chart below I’ve included the 4 main US bond yields you need to have on your watchlist.
Green: US02Y
Red: US05Y
Orange: US10Y
Blue: US30Y
When we’re in an environment like this where central banks are tightening policy and looking to raise rates bond yields (both short term and long term) will go up over time (as shown below) as they’re clearly following the trajectory of the fed.
However, the key thing to note in the chart below is how long term yields (US10Y-US30Y) are lagging shorter term yields and this tells us an interesting story which is the final piece to the puzzle.
The Yield Curve
As I mentioned right at the beginning, bond yields filter out the noise of other asset classes and give investors a clear view of the economy. The yield curve does this by looking at the spread between short term yields and long term yields.
The US02Y/US10Y (2s10s for short) is amongst the most closely watched spread/indicator by macro investors as they’re both key short/long term indicators of interest rates.
At the time of writing these are the returns from both short term and long term yields:
US02Y: 1.51%
US05Y: 1.75%
US10Y: 1.87%
US30Y: 2.25%
Now we can describe the yield curve in 3 ways:
Steepening Curve
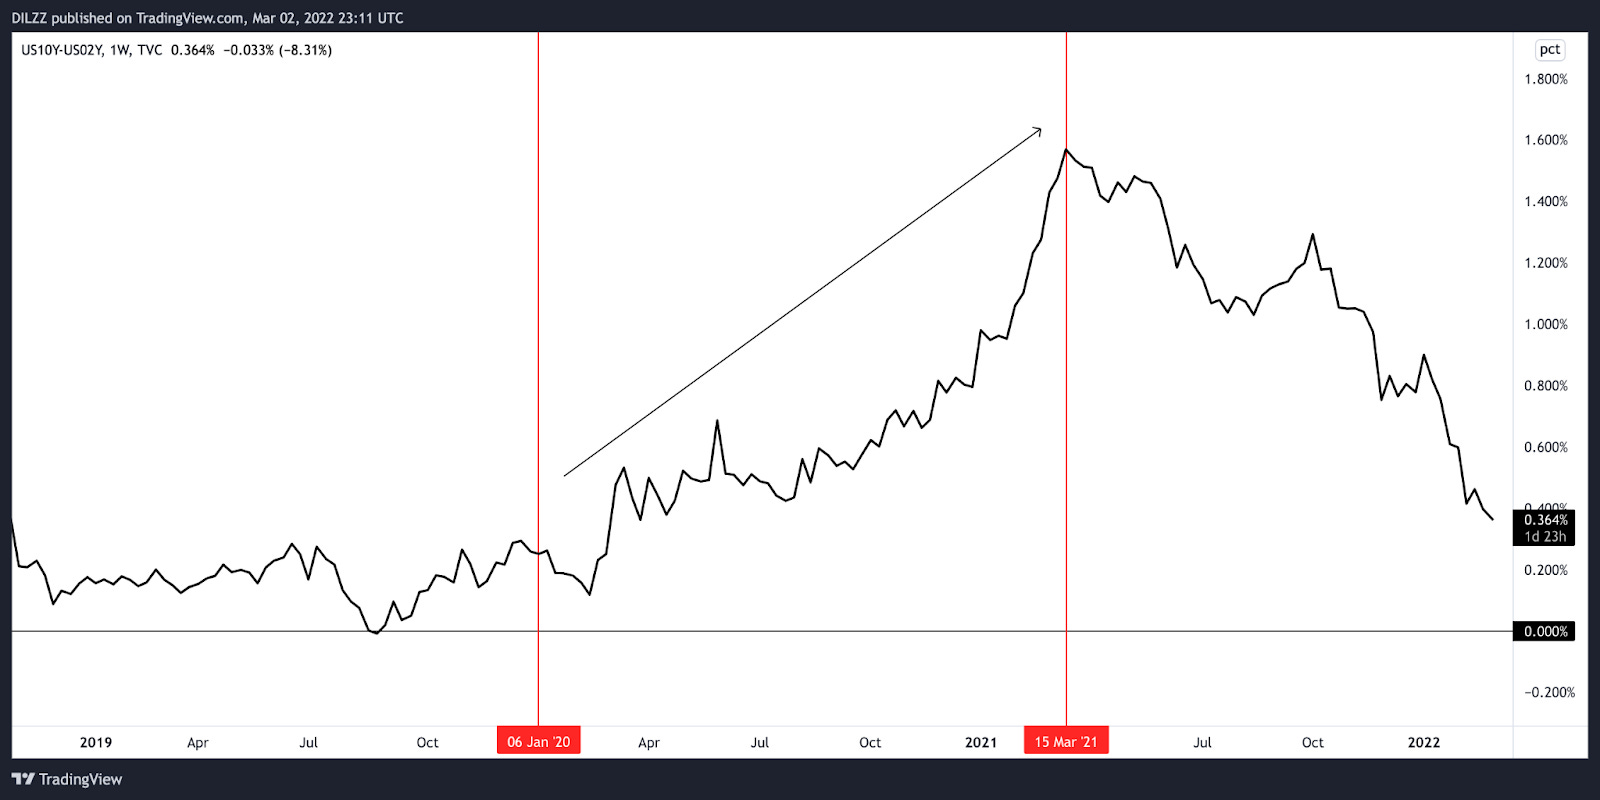
A steep yield curve is where long term yields are rising faster than short term yields or short term yields are falling and long term yields are rising. You tend to see this in low interest rate environments when economic growth is accelerating. This is a risk on indicator, you want to be exposed to high beta stocks and crypto during these times.
Looking at 2s10s from March 2020-March 2021 the economy was roaring back after covid, and markets were fully risk on, therefore the curve was steepening.
Flattening Curve
A flattening yield curve is what we’re seeing now where there is only a small difference between short/long term yields. This is either where short term yields are rising faster than long term yields, or long term yields are falling and short term yields are rising.
A flattening yield curve is typically an indication that investors are worried about the long term outlook.
Again, using the 2s10s example, from March 2021 to the time of writing this the curve has been flattening. Interestingly enough Bitcoin put in it’s first top in March 2021 too…
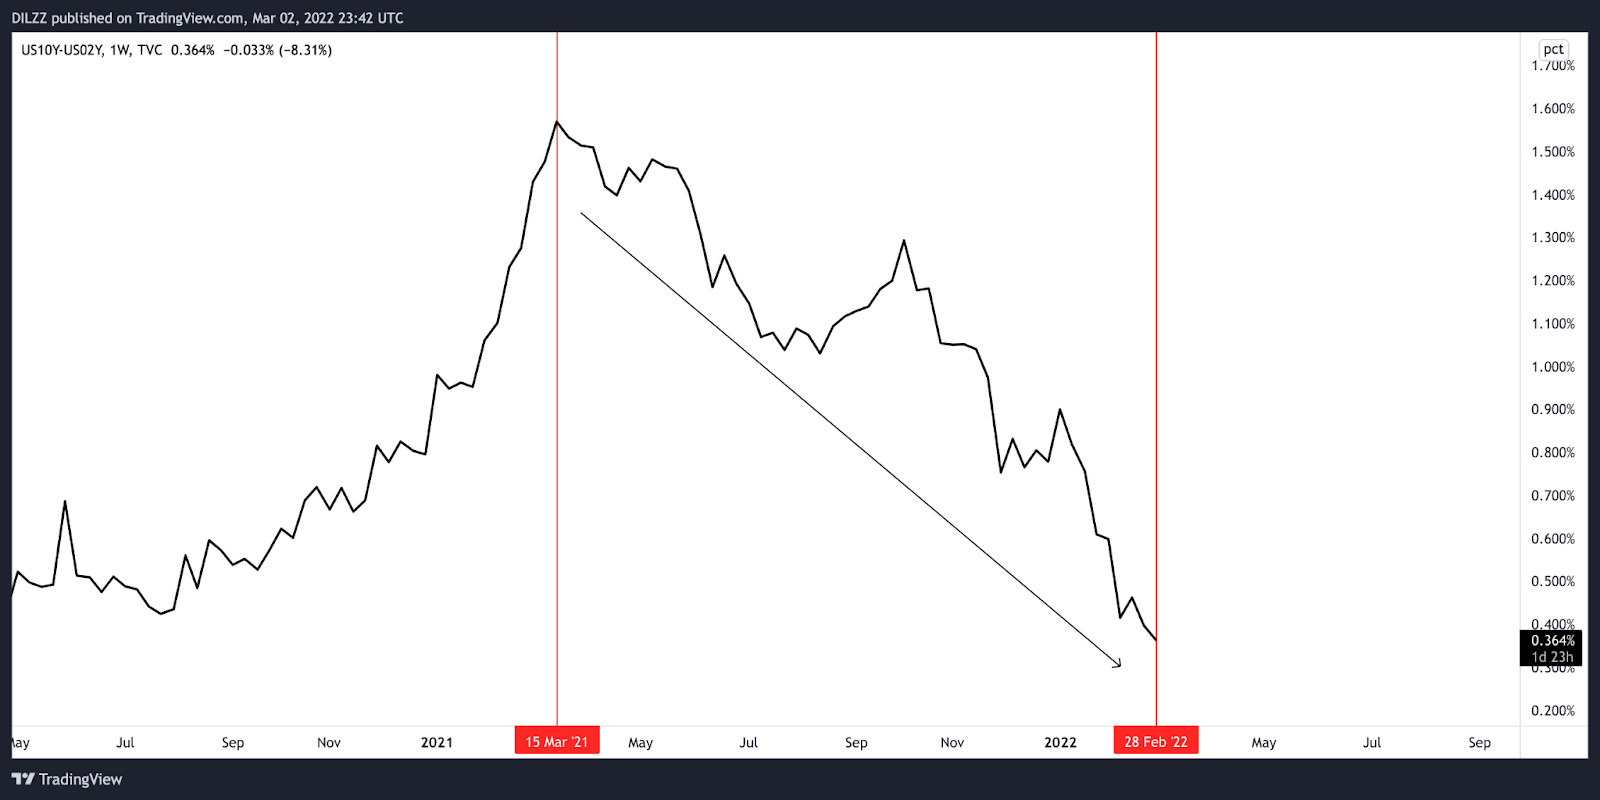
During this time inflation was becoming a problem and multiple covid variants were spreading across the globe raising questions about growth. In this environment, you can still be exposed to risk assets (depending on how flat the curve is). However, you need to be aware of any changes in dynamics regarding growth and inflation which could have a short-medium term impact on any of your positions.
Inverted Curve
When the 2s10s inverts alarm bells should be ringing for you!
One thing to understand about the yield curve is it has predictive powers. Over the last 2 decades anytime 2s10s have inverted (gone to 0% or negative) it has been a warning for a recession to take place within the following 12-18 months.
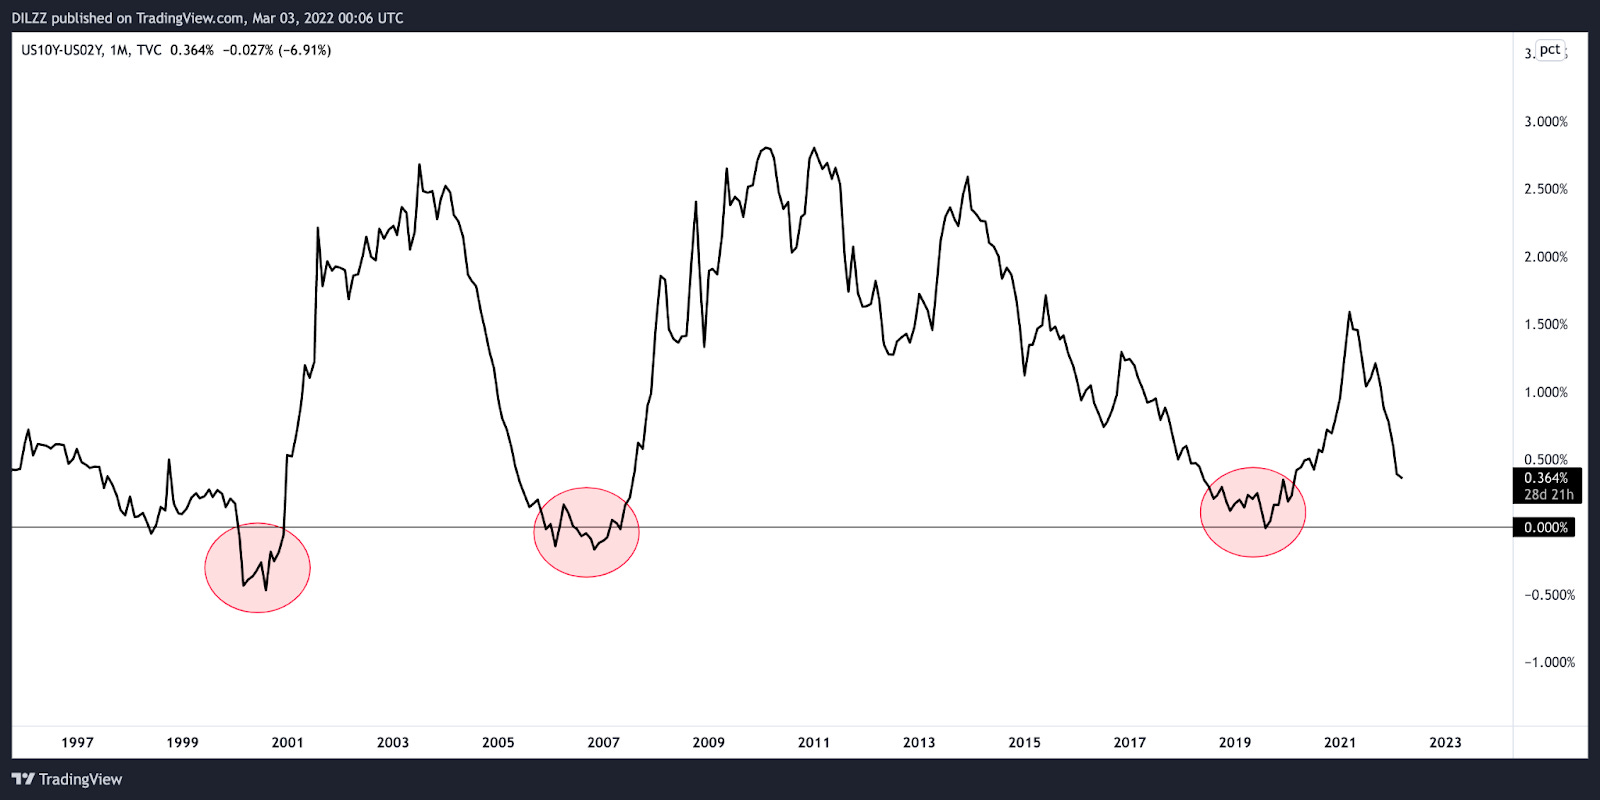
2000: This indicator went deeply negative in the year 2000 and what followed was the end of the historic tech bubble and the 9/11 attacks which led to a recession.
2007: After the 2000 fiasco, the fed funds rate went from 6.5% to 1%. From 2004-2006 the fed raised their rate back up to 5% which blew up a giant housing bubble, and then we all know what happened in 2008…
2019: In August 2007 the fed funds rate was at 5.26%, by January 2009 this was at 0.15%. After 7 seven years of near 0 interest rates the fed began to take it back up to 2%. After rates went up, a general recession began in late 2019 plus the addition of the global pandemic, catalysed this into one of the sharpest recessions on record.
In these kinds of environments, you want to be risk off and prepared with a decent percentage of cash in your portfolio.
Currently, 2s10s are at 0.35%.
Final Thoughts
Even though bonds are a pretty crappy investment and something today’s generation of investors wouldn’t even bat an eyelid at, the insights we can gain from looking at this market are imperative to allocating capital.
Take your time to study how the bond market has moved in the past, especially during the 3 periods I mentioned above; 2000, 2007, 2019. Look at when the yield curve was steepening, flattening and then inverting, it will all correlate with global growth, inflation and whether risk assets were outperforming or correcting.
Remember, history never repeats but it sure as hell does rhyme!
If you have any questions about any of the content in this newsletter, or want to reach out to me personally, you can reach me at macroiqglobal@gmail.com.